Skip to content

January Data Sings the Blues

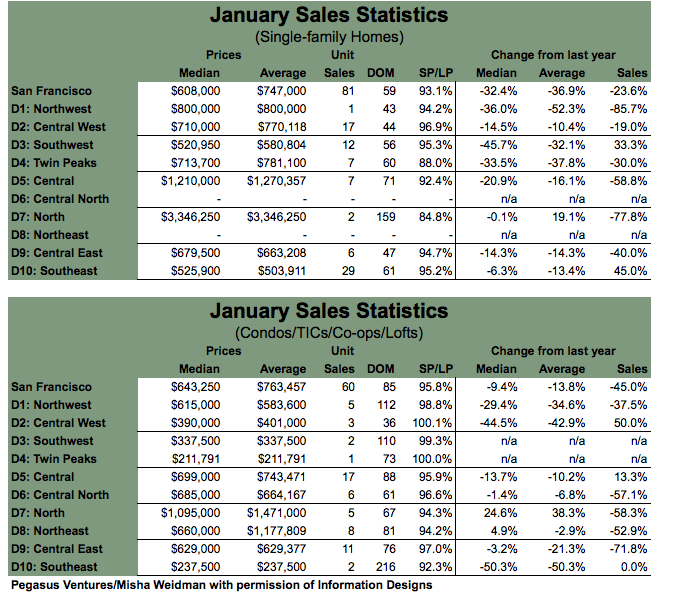
Here’s the latest sales data broken down by MLS District.  Full reports are available here under the Market Trends Tab and are well worth a look.

picture-2

Median and Average prices are down substantially year over year for single family homes in all districts except District 7 (“North”, which includes top-shelf enclaves like Pacific Heights and the Marina), but with only 2 sales for the month in that area, it’s not a meaningful statistic.  Indeed, as I’ve pointed out in previous blogs, sales drop off so dramatically every year during December/January that I’d be cautious reading too much into the  statistics for those particular months.  ...  Additional Details

What $2.1 million buys in Noe Valley

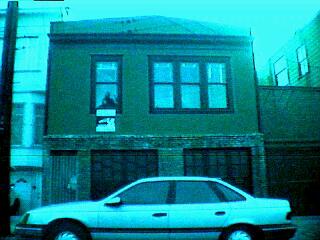
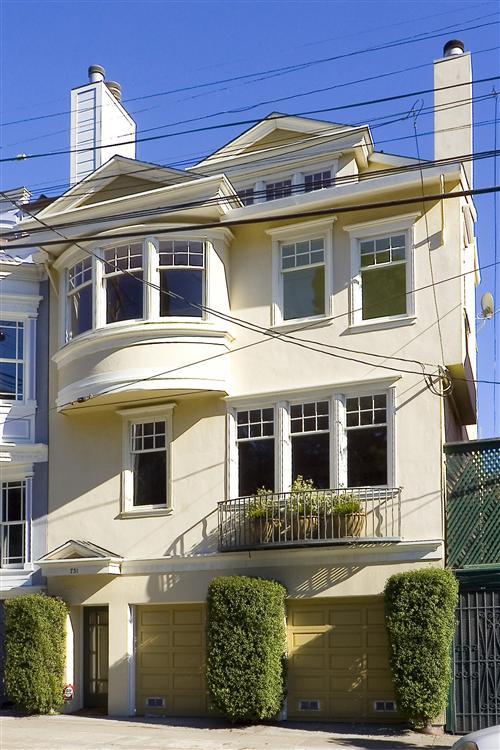
Out on brokers’ tour yesterday, I looked in on two homes  available in my Noe Valley neighborhood, priced within $2,000 of each other.  731 Douglass (at 24th Street) sold in March 2005 for $1.944 million and a mere $29o,000 in March 1997, when it was a sad-looking 1200 ft marina-style house, with a 6-car garage.  Back then:

731-douglass-old

and now:

731-douglass-now

In 1999, the owners completely redid the building, right around the same time that my wife and I were remodeling our house just around the corner and converting it from a two-unit building into a single family home.  At the time, there weren’t too many larger homes in Noe Valley.  Now, everybody seems to be adding floors or building out the basement. ...  Additional Details

Supply/Demand: Does it predict price? Maybe not.

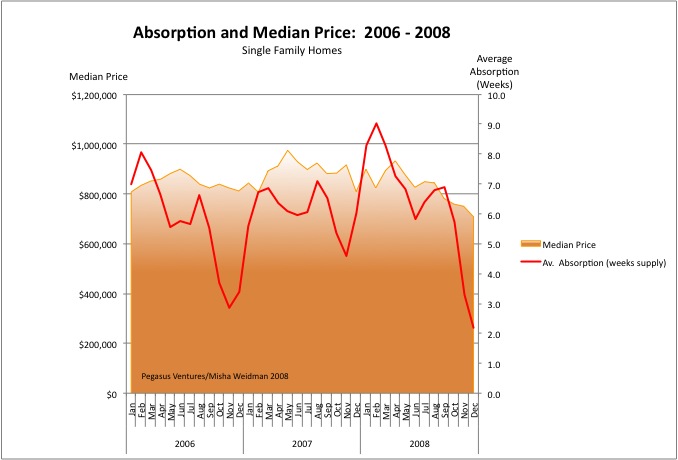
Now hold on there, matie!  Basic economic theory  says more supply than demand, prices will fall, right?  Well take a look at this graph. It shows the absorption rate of single family home listings from January 2006 through December 2008 plotted against median prices (click to make it bigger):

absorption-price-chart1

“Absorption” is basically the number of weeks it would take to sell all the homes available on the market based on the number of homes that are selling at that time.  (I’ve tweaked the formula to diminish the spikes caused by the huge seasonal dropoff in new listings each December/January.)   There are many ways to calculate absorption, but the basic idea is simply to capture how quickly demand is eating supply.  Less time to absorb the supply should reflect a “hotter” market where sellers can demand top dollar. A higher absorption rate, on the other hand, means that there’s relatively more listings on the market than demand for them.  That would tend to suggest a buyer’s market and softer prices. ...  Additional Details