Focus on Potrero Hill

Back from vacation, and ready to blog and roll!

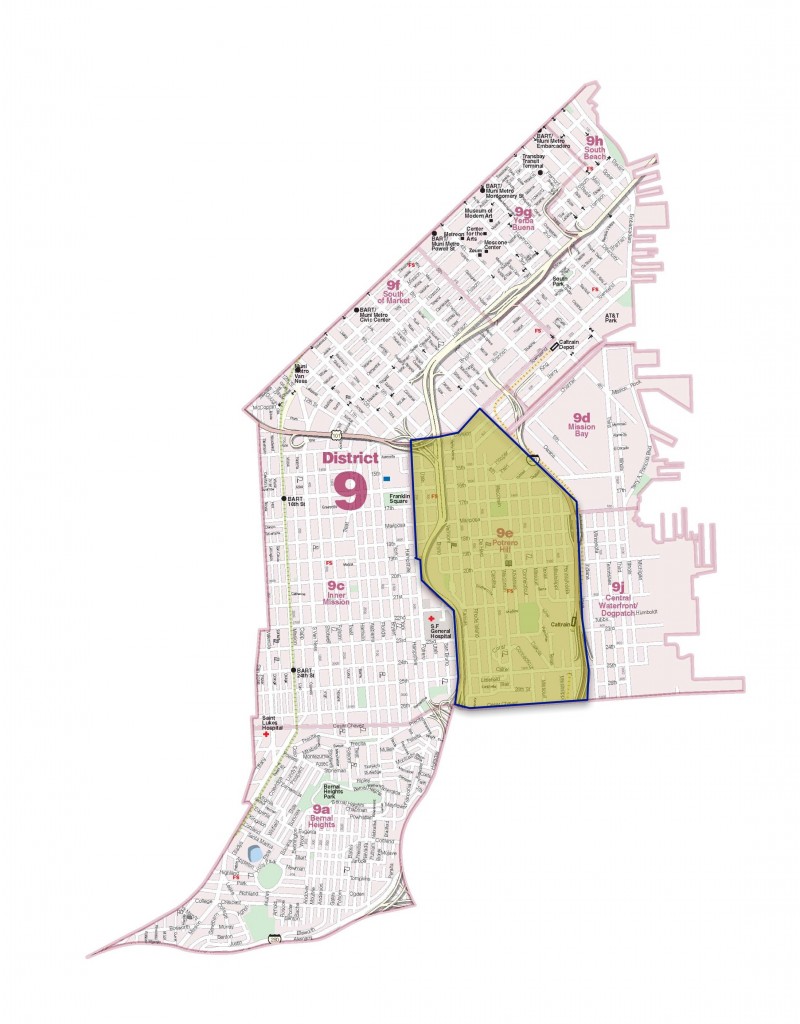
I’m currently working with a couple of clients looking for homes in the Potrero Hill District.  Here, we’re talking specifically about subdistrict 9.E under San Francisco’s MLS (Multiple Listing Service).

It’s an area that roughly sits between I-280 and I-101, with Cesar Chavez at its the south end and the tangle of 101/Design District/Division at its north end.  With major arteries at all ends as well as proximity to Caltrain, it’s a favorite for people who need good commute access.  It’s also got some of the best weather in San Francisco.  The crest of Potrero Hill sits at intersection of Carolina and 22nd Street.  Homes on the  “north slope” — ie.  north of 22nd Street — boast spectacular views of downtown SF and the Bay and therefore fetch a premium.   Potrero Hill has a small but upscalish shopping/cafe strip located on 18th between Connecticut and Texas.  The recently opened Whole Foods at Rhode Island and 17th hasn’t hurt either.  Architecture is a mix of broad two-story Victorians and newer modern structures designed to take advantage of the weather and the views, especially on the north slope. ...  Additional Details

Districts 3 and 10, R.I.P.

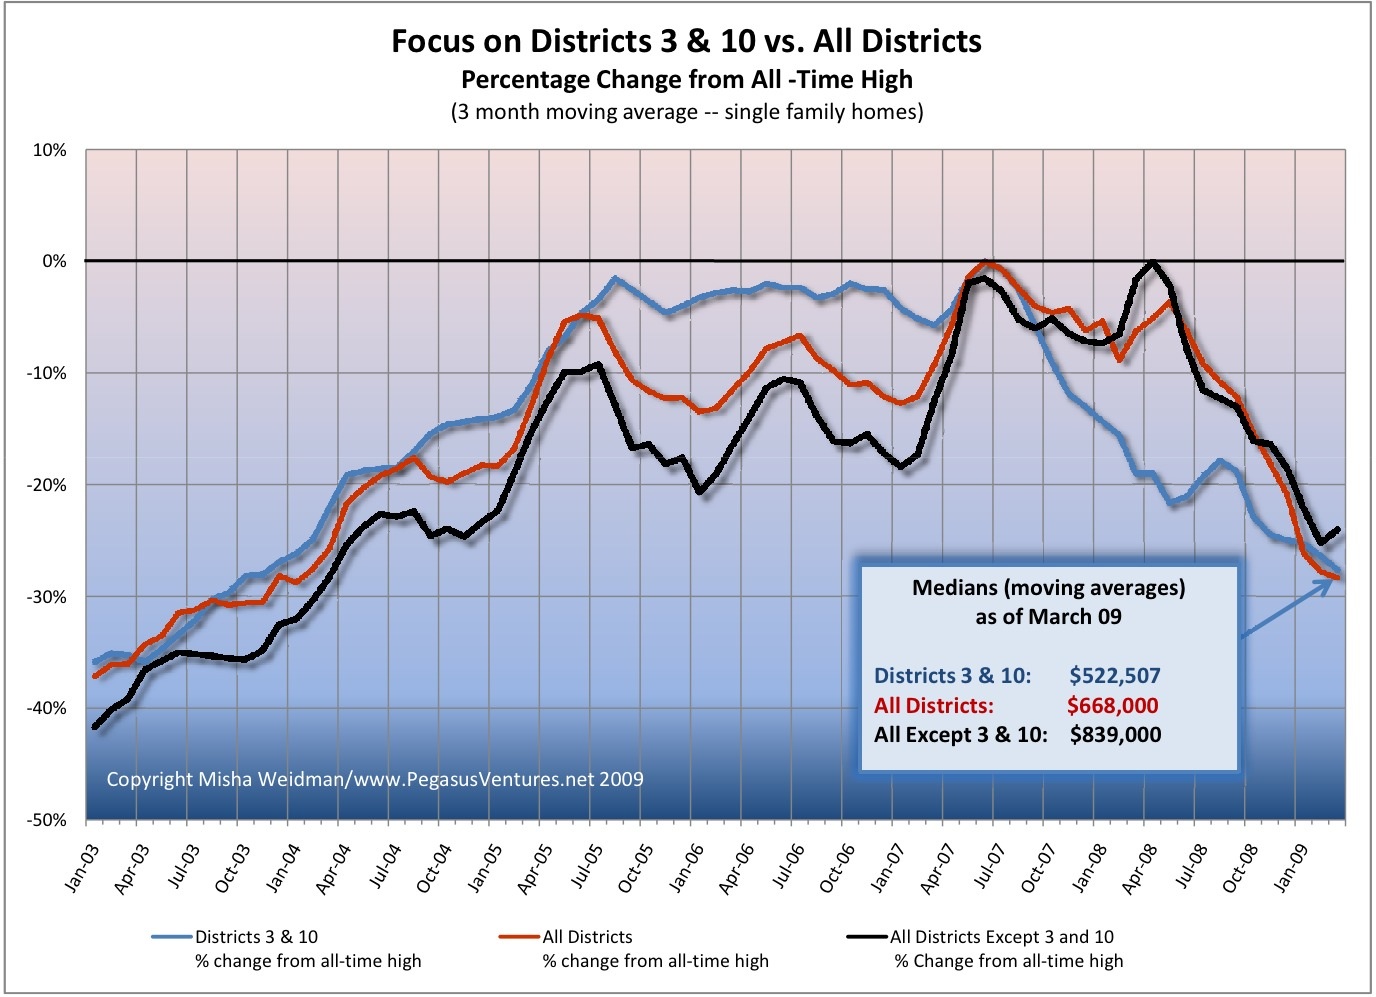
The Excelsior, Bayview, Hunter’s Point, Oceanview, Ingleside:  these are some of the neighborhoods included in the San Francisco Association of Realtors’  MLS (Multiple Listing Service) Districts 3 and 10.  It’s been suggested here and elsewhere  that perhaps these non-“core” San Francisco neighborhoods have been pulling down San Francisco’s home prices disproportionately.  The theory, plausible enough, is that these more modestly-priced neighborhoods would be feeling the effects of the economic slowdown more than the tonier “core” neighborhoods, whose denizens’ bank accounts might provide a little more padding against hard times.
I recently published a chart that compared the percentage change of Districts 3 and 10 from their all-time highs to that of the city as a whole.  Some readers of theFrontSteps expressed an interest in seeing what the chart would look like if you excluded those districts from the data set for the city as a whole.  (Districts 3 and 10 make up over 20% of the city’s single family home sales for the 5 year period covered by the chart.)  I aim to please, so I ran the numbers again and here are the results.
focus-on-dists-3-and-10-vs-all-dists ...  Additional Details

Skip to content