

Happy New Year everyone! San Francisco residential real estate recorded another year of double-digit appreciation last year. Our Chief Market Analyst has been busy slicing and dicing the data every which-way, and has created over 20 charts that serve up the market from soup to nuts (which, is exactly how some people view it!). You can experience the full meal at Paragon Real Estate Group’s main website. I’m doing the prix fixe menu here for those with less time and/or appetite.
The Long View
We’ll start with a long look back. The following chart is a simplified version of Case Shiller’s closely-followed index for San Francisco Bay Area real estate covering 5 counties including San Francisco. (The “high price” tier is the best proxy for homes in San Francisco proper.)
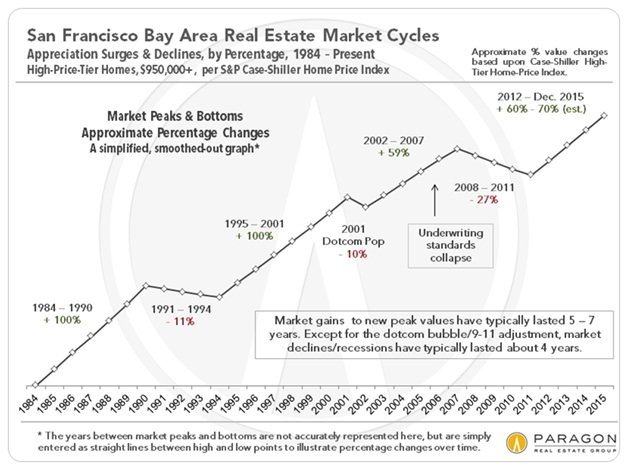
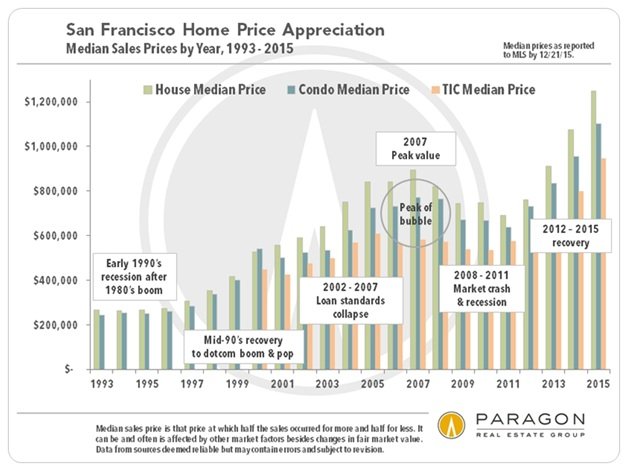
On the heels of the greatest financial crisis since the Great Depression, home prices started sliding in late 2007 and hit bottom in 2011. Four years later, prices are up more than 60% from their lows and are well above their pre-bust peaks. The next chart shows property values based on San Francisco data alone.
More than anything else, these two charts explain why I’m bullish on San Francisco real estate over the long-term. Sure, we will have blips, dips, and even plunges. But this city has repeatedly shown that it will recover from downturns, and in relatively short order. As long as your time horizon is a minimum of 5 to 7 years, I believe that buying a home here is a safe bet, not to mention the psychic benefits a home bestows. (As to whether it’s a good investment compared to other possibilities, that’s a more complex question, but here’s one positive, if admittedly selective, take.)
Median Prices Up Again
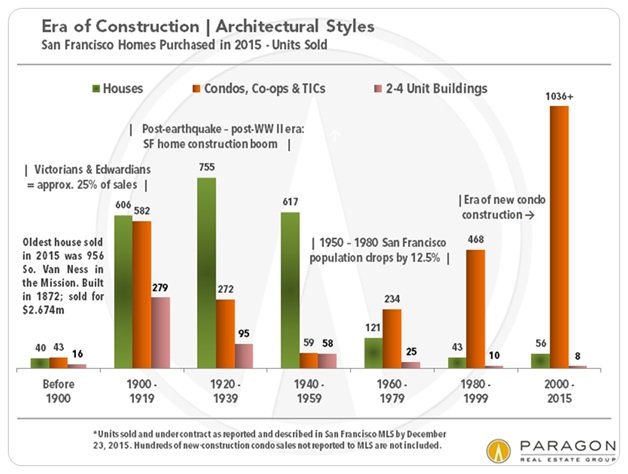
The Home Price Appreciation Chart above shows that the median price of a single family home hit $1.25 million at the end of 2015, up 11% from Q4 2014. Condos did very well too, ending the year at around $1.125 million, up 13% over the same period. The fact that condos did “better” than single family homes is probably due to the influence of more recently built, and more expensive units, in the sales mix. Take a look at the chart below, which breaks down 2015 sales by the era of construction. It’s clear that condos built since 2000 dominated condo sales in 2015 and will continue to do so. What’s equally clear is that very few new single family homes and 2-4 unit buildings are being built. Hence the premium people are willing to pay for those that are.
Sales by Property Type
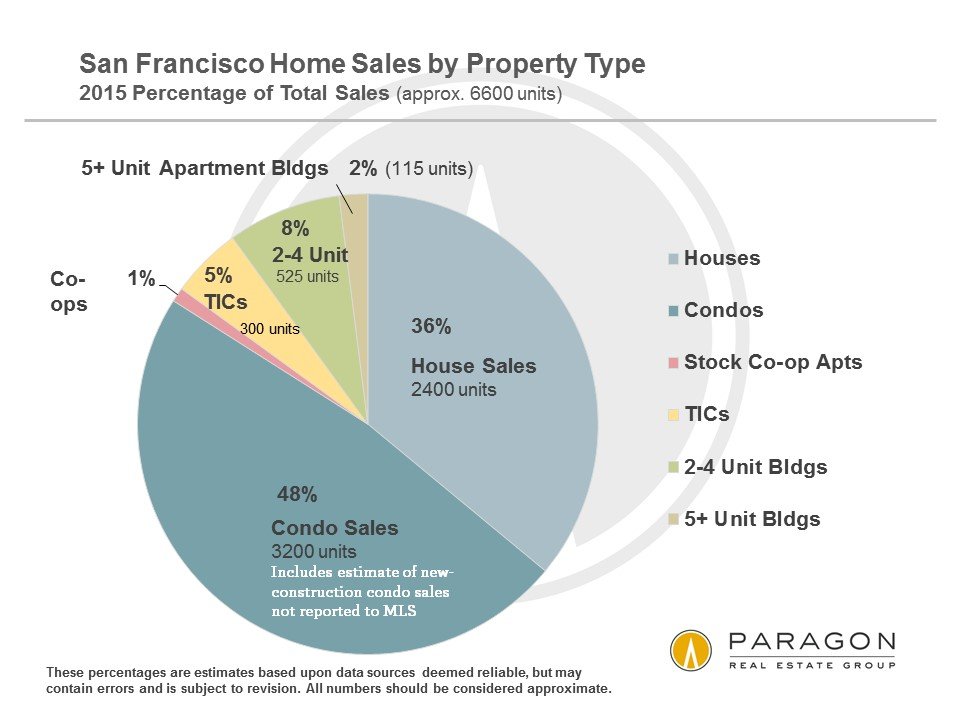
Many people seem surprised by how few sales occur annually in San Francisco. We estimate total 2015 sales of all property types to be well under 7,000 units. That includes sales of “off-market” listings and new construction condos that aren’t listed or marketed through the MLS (Multiple Listing Service), from which we get most of our data. The numbers on the pie chart below are approximate.
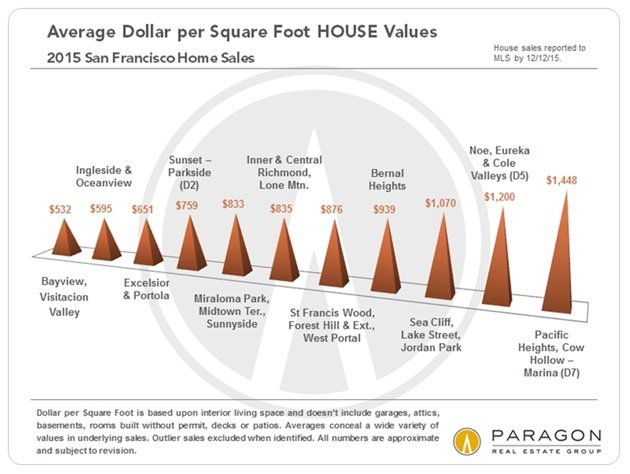
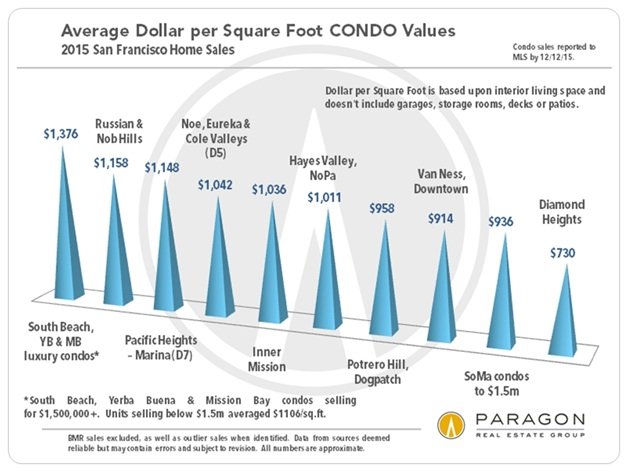
Price Per Square Foot
“Location, location, location” still applies when it comes to pricing. The following charts show price per square foot by neighborhood and there really aren’t any surprises here, with San Francisco’s luxury neighborhoods leading the way. The left-most pyramid in the second chart breaks out “luxury” condos selling for above $1.5 million in the new tower and mid-rise developments of South Beach and Mission Bay. I’m not sure that “location” drives the prices here so much as views and amenities.
You can find an interactive map that shows updated median sales prices by neighborhood on my home page, here.
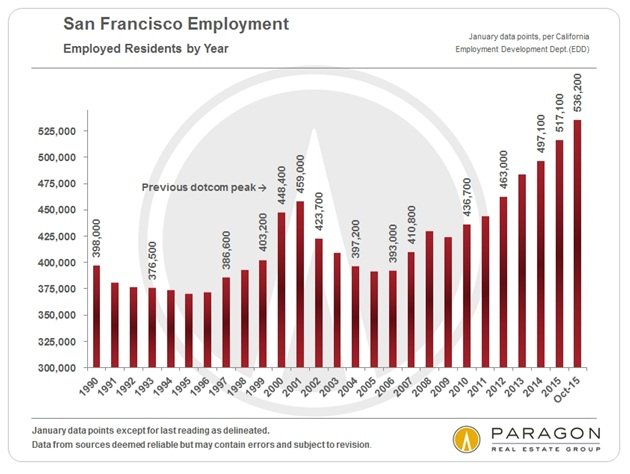
What’s Driving the Market?
In a nutshell, stupendous job/employment growth coupled with limited supply. We’ve built 12,000 units of housing in San Francisco since 2010. Over the same 6 years, thenumber of employed residents has increased by over 100,000. Of course, there are other factors too, including low interest rates, high rents, and the presence of an astonishing number of unicorns. (More factors discussed here.)
The Crystal Ball
Actually, I only have a Magic 8-Ball, and it says “Ask Again Later,” which is essentially what I said in my last newsletter too. Will interest rates increase as expected? Will global stock market weakness led by China negatively affect buyer and seller sentiment here in SF? And what if Zynga loses its zing and Twitter tweets no more? This spring may show where the market’s heading, but if you’re a buyer I’d be looking actively during these winter doldrums when there is appreciably less competition, and if you’re a potential seller I’d be getting your ducks lined up now so that you can hit the market as soon as the weather warms up.
As always, your questions, comments, and referrals are much appreciated!