
It’s hard to believe it’s already 2014! There’s such an abundance of events throughout the year in our amazing city, where does one begin? Well, we have something to help get you started. So before you book up your weekends, … Continue reading
Real Data SF January 2014 Newsletter: The 2013 Real Estate Wrap-Up
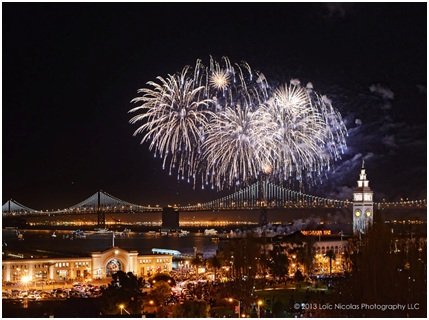
Photo courtesy of loicphoto.com
San Francisco Bubbles
Happy New Year one and all! While much of the rest of the country was just beginning to come out of its long recessionary swoon, our little piece of heaven enjoyed its second full year of a booming sellers’ market, fueled in no small part by what appears to be a decisive shift in venture capital to our local zip codes. Those much-despised Goo-hoo buses are no accident. Take a look at this instructive chart from an August 2013 piece in The Atlantic entitled “Why San Francisco May Be the New Silicon Valley”: ...
2014 – January Market Report
San Francisco Real Estate: Looking Back, Looking Ahead The real estate market recovery started in earnest in 2012 and then went white hot in spring 2013, which resulted in a huge jump in home prices. In the last six months … Continue reading
San Francisco Housing Units: Inventory By Property Type
After investigating with the Departments of Planning and DPW, their inventory and pipeline reports, U.S. census data, MLS data, Andy Sirkin, NAHB and a half dozen other resources, we came up with the following estimates about San Francisco housing inventory: … Continue reading
Great Dickens Christmas Fair – December 22, 2013
 The Great Dickens Christmas Fair is a one-of-a-kind holiday adventure into Victorian London - an elaborate party with hundreds of costumed players performing and interacting with patrons in over 120,000 square feet of theatrically-lit music halls, pubs, dance floors and Christmas shops. Continue reading
View from atop Bernal Hill (after checking out some houses of course!)

What SF Homebuyers Bought in 2013: A Survey
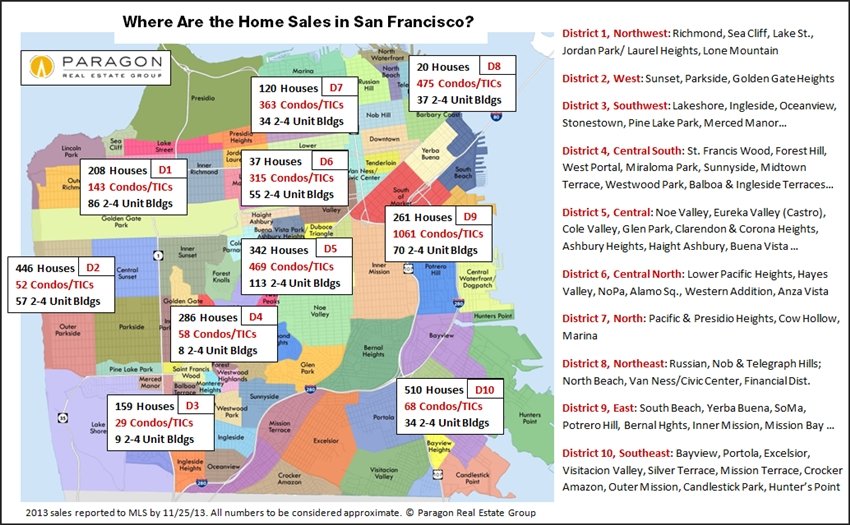
Penthouses, Mansions, Short Sales & Fixer-Uppers
What Did San Francisco Homebuyers Buy in 2013?
Views, prices, architecture, neighborhoods, property types and sizes, parking, probate sales and appreciation rates: We data-mined all of San Francisco’s 2013 sales reported to MLS through the end of November and charted the results below.


Sales as described in and reported to San Francisco MLS by 11/25/13. All data herein is from sources deemed (at least somewhat) reliable — i.e. the information input by listing agents regarding their own listings — but may contain errors and is subject to revision. These charts do not include sales unreported to MLS, such as the sale of many so-called “pocket listings” and many of the new-development condo sales that occur. ...
September Case-Shiller Index Released
The Case-Shiller Index for the San Francisco Metro Area covers the house markets of 5 Bay Area counties, divided into 3 price tiers, each constituting one third of unit sales. Most of the city of San Francisco’s house sales are in the “high price tier.” The Index is published 2 months after the month in question and reflects a 3-month rolling average. September’s Index was just released today, November 26th.
This first chart illustrates the price recovery of the Bay Area high-price-tier home market which really got under way in 2012. In both 2012 and 2013, home prices surged in the spring and then plateaued in the summer-autumn. The surge in prices that occurred in spring of 2013 was particularly dramatic, reflecting a frenzied market of huge buyer demand, historically low interest rates, increasing consumer confidence and extremely low inventory. In San Francisco itself, it was further exacerbated by the high-tech-fueled explosion of new wealth. The market has since calmed down somewhat and that cooling is reflected in the Index readings of the past three months (through September). ...