
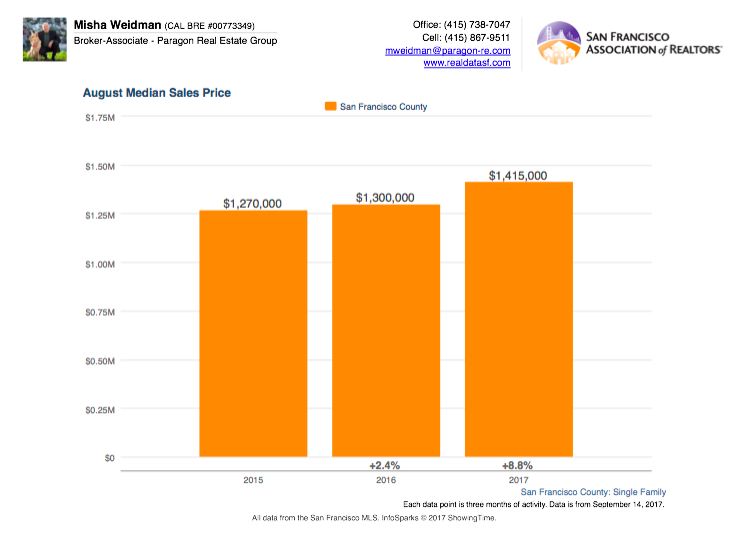
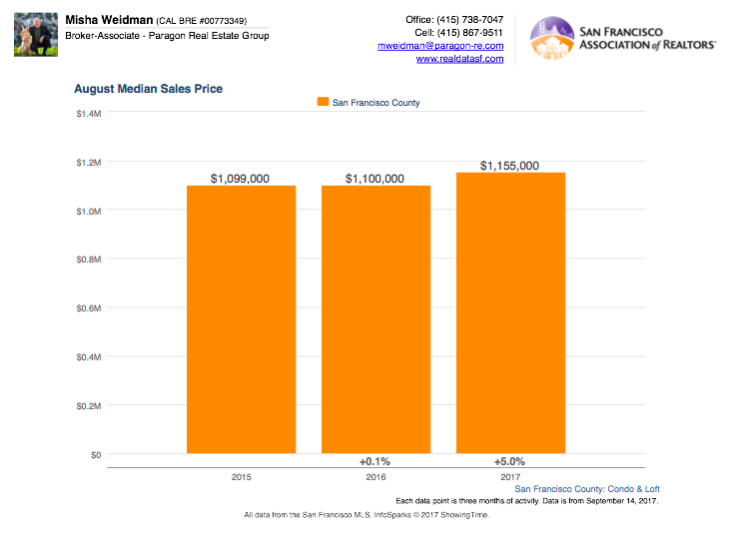
As I was getting ready to send out yet another newsletter showing further year over year gains in home prices(see first two charts below for single family homes and condos, respectively), I took a closer look at a chart that focuses on the supply side of the supply/demand equation.
“New Listings Coming On the Market” is the simplest indicator of how many homes are being put up for sale in any given time period. Take a look at the chart below, which tracks new listings (homes, condos, etc.) on a rolling 12 month basis.
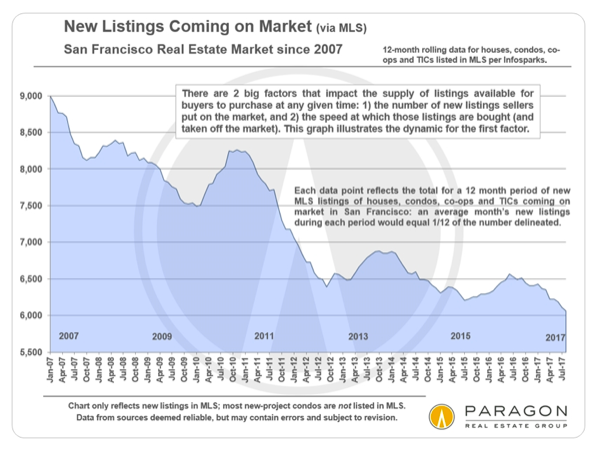
They dropped from 9,000 units at the start of January 2007 when we were still in boom times to under 6,500 in October 2012, when the recovery from the Great Recession had been underway for less than a year. By October of 2013, listings had climbed back up to around 6,800, most likely reflecting the previous year’s recovery, but the trend line has been consistently and considerably down ever since. In July 2017 we were at barely over 6,000 new listings for the previous 12 months.
There are caveats, the biggest being that these numbers don’t include new condos being marketed for the first time directly by the developers; these units don’t show up in MLS statistics. But even if these add a few hundred units per year, they tend to be a very particular product — mostly high end, high rise, downtown units. What the chart above reflects, in my opinion, may be a long-term structural change in the market.
What’s going on here? Why are there about a third less homes being put up for sale in 2017 than there were a decade ago, especially considering that SF was booming then as now? And why has this downward trend persisted for at least the last four years? Why do we care? Here’s a stab at some answers.
Inexorable Demographic Trends
A recent Bloomberg article describes the growing trend of “aging in place” — and its effect on the share of the home ownership held by the baby-boom generation versus today’s millennials:
People 55 and older own 53 percent of U.S. owner-occupied houses, the biggest share since the government started collecting data in 1900, according to real estate website Trulia. That’s up from 43 percent a decade ago. Those ages 18 to 34 possess just 11 percent. When they were that age, baby boomers had homes at almost twice that level.
This is a remarkable and significant change. The people who have homes just aren’t moving on and out like the used to. The article suggests several reasons: property tax rules make staying in place more attractive (see last month’s newsletter); the lack of affordable homes to move to; and the fact that people are making a life-style choice to stay put in their retirement.
The CEO of Redfin described what he saw as a national “persistent inventory shortage” in a recent New York Times article as well. Part of this is hangover from the housing bust, which, while it lasted, left many home-owners hanging on for dear life. But it also resulted in a more cautious approach to new construction and lending. Additionally, those who were lucky enough to lock in rock-bottom interest rates during the depths of the recession may be unwilling to lose those rates by jumping into a new home and having to take out a new loan at rates that are higher and are likely to go higher still.
Rather, owners are increasingly deciding to stay put and renovate instead. Or, those that can afford to are keeping their properties and renting them out to capitalize on the spread between low interest rates and high rents.
Staying Put Longer
All this has resulted in a huge increase in the average time that homeowners are staying put, from under 4 years at the start of 2000 to around 8.7 years at the start of 2016, according to the New York Times article.
Why Do We Care?
Simple. In a market like San Francisco’s, where new inventory is constrained by geography and high legislative hurdles (compare to, say, Las Vegas), the fact people are increasingly staying put for longer means that less existing inventory is going to be available on the supply side of the equation. Even if demand stays the same, that suggests upward pressure on prices because there’s less supply available to satisfy it.
What if demand falls, as it most surely will at some point? Sure, prices will doubtless fall. For a time, anyway. But my point is demographic trends alone are likely to support home prices in a market like San Francisco where new supply is constrained.
Or at least until old farts like me have died off in sufficient numbers for the millennials to take over.
As always, your questions, comments, and referrals are much appreciated. I also have more detailed charts available on home prices on specific neighborhoods. Just shoot me an email with a specific inquiry and I’ll send it to you.
Regards,
Misha
Amazing insight and comparison. Great presentation of important information. Thanks for sharing.