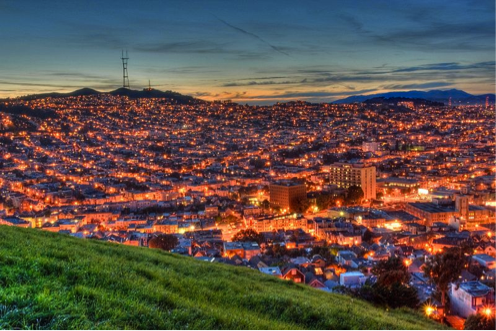
5 White-Hot Districts in a Red-Hot San Francisco Market July 2013 Report Virtually every area of San Francisco and the Bay Area has been experiencing dramatic home-value appreciation in the past 12 to 18 months. Some that were hard hit … Continue reading →
Updated Charts: Potrero & Bernal
Potrero Hill Houses: another challenging place for statistics because of the low number of sales and the variety of houses that do sell. Median and average prices jump all over the place, but there’s a relatively clear, consistent story for … Continue reading →
Updated Housing Market Charts
Noe & Eureka Valley Houses: Cole Valley-Ashbury Heights-Clarendon & Corona Heights Houses: Glen Park Houses: Condos, Selected District 5 Neighborhoods: District 5 Residential 2-4 Unit Buildings: District 2 Houses Inner Sunset House Median Sales Price. FYI: Inner Sunset general dollar … Continue reading →
South Beach/ SoMa Value Charts – Updated
Inner Mission Condo Values
How Hot is My Valley

How Hot is My Valley
Noe Valley that is. The place I’ve called home since May 1991 when I bought a vacant two unit building with a monumentally dreary exterior, deeply embedded cat-pee stains in the hardwood floors, and rooms with great volume and light.
This month’s newsletter is dedicated to the Noe Valley market, and the nearby areas of Eureka Valley (aka the Castro) and Cole Valley, which have a similar feel and housing stock.
San Francisco & Bay Area Home Values – in Maps
May 2013 Update Below are 3 maps delineating recent median home sales prices and/or average dollar per square foot values for San Francisco neighborhoods and communities around the Bay Area. These statistics are generalities which may fluctuate for a variety … Continue reading →


