The Case-Shiller Index for the San Francisco Metro Area covers the house markets of 5 Bay Area counties, divided into 3 price tiers, each constituting one third of unit sales. Most of the San Francisco’s and Marin’s house sales are in the “high price tier”, so that is where we focus most of our attention.” The Index is published 2 months after the month in question and reflects a 3-month rolling average, so it will always reflect the market of some months ago. June’s Index was released on the last Tuesday of August.
The 5 counties in our Case-Shiller Metro Statistical Area are San Francisco, Marin, San Mateo, Alameda and Contra Costa. Needless to say, there are many different real estate markets found in such a broad region, and it’s probably fair to say that the city of San Francisco’s market has generally out-performed the general metro-area market.
The first two charts illustrate the price recovery of the Bay Area high-price-tier home market over the past year and since 2012 began, when the market recovery really started in earnest. In both 2012 and 2013, home prices surged in the spring and then plateaued in the summer-autumn. The surge in prices that occurred in spring of 2013 was particularly dramatic, reflecting a frenzied market of huge buyer demand, historically low interest rates, increasing consumer confidence and extremely low inventory. In San Francisco itself, it was further exacerbated by an expanding population and the high-tech-fueled explosion of new wealth. The market then calmed down somewhat in the second half of 2013, but then heated up yet again in early 2014. In fact, the spring 2014 market was, if anything, even more ferocious than last year’s. Typically, the market cools off for the summer months and that is what we are starting to see in the Case-Shiller numbers (which, again, are some months behind the current market). The next big indication of market trends will come after the autumn selling season begins in mid-September.
For more regarding how seasonality affects real estate: Seasonality & the Real Estate Market
Case-Shiller Index numbers all reflect home prices as compared to the home price of January 2000, which has been designated with a value of 100. Thus, a reading of 198 signifies home prices 98% above those of January 2000.
Short-Term Trends: 12 Months & Since Market Recovery Began in 2012

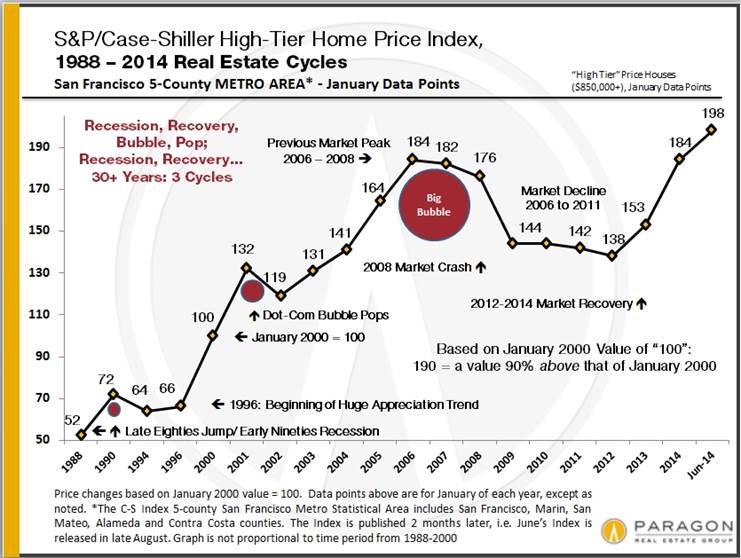
Longer-Term Trends & Cycles
The third and fourths charts below reflect what has occurred in the longer term (for the high-price tier that applies best to San Francisco and Marin counties), showing the cycle of recession, recovery, bubble, decline/recession since 1996, and since 1988. Note that, past cycle changes will always look smaller than more recent cycles because the prices are so much higher now; if the chart reflected only percentage changes between points, the difference in the scale of cycles would not look so dramatic.

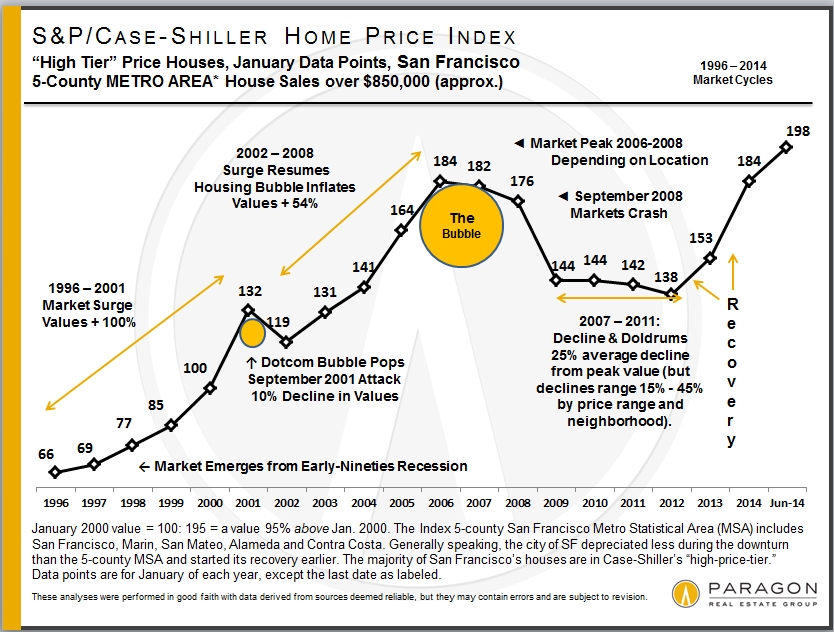
Different Bubbles, Crashes & Recoveries
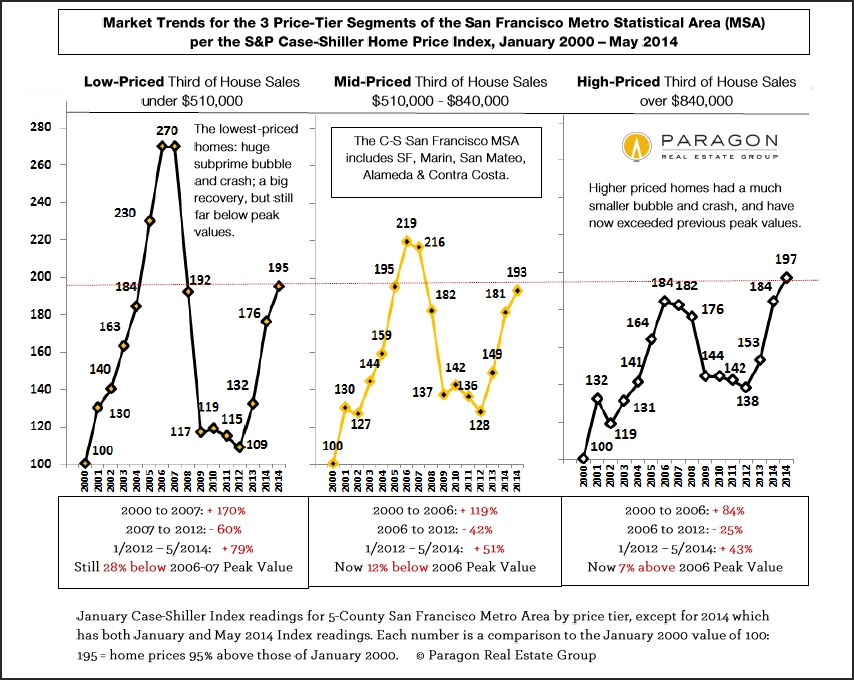
This next chart compares the 3 different price tiers since 2000. The low-price-tier’s bubble was much more inflated, fantastically inflated, by the subprime lending fiasco – an absurd 170% appreciation over 6 years – which led to a much greater crash (foreclosure crisis) than the other two price tiers. All 3 tiers have been undergoing dramatic recoveries, but because the bubbles of the low and middle tiers were greater, their recoveries leave them well below their artificially inflated peak values of 2006. It may be a long time before the low-price-tier of houses regains its previous peak values. The high-price-tier, with a much smaller bubble, and little affected by distressed property sales, has now exceeded its previous peak values of 2007. Most neighborhoods in the city of San Francisco itself have surpassed previous peak values by substantial margins.
It’s interesting to note that despite the different scales of their bubbles, crashes and recoveries, all three price tiers now have similar overall appreciation rates when compared to year 2000. As of May 2014, as seen below, appreciation for all three tiers since 2000 ranged from 93% to 97%. In June (not shown below), this range narrowed further to 96% to 98%. This suggests an equilibrium is being achieved across the general real estate market.
Different counties, cities and neighborhoods in the Bay Area are dominated by different price tiers. Bay Area counties such as Alameda, Contra Costa, Napa, Sonoma and Solano have large percentages of their markets dominated by low-price tier homes (though all tiers are represented to greater or lesser degrees). San Francisco, Marin, San Mateo and Santa Clara counties are generally mid and high-price tier markets, and sometimes very high priced indeed. Generally speaking, the higher the price, the smaller the bubble and crash, and the greater the recovery as compared to previous peak values.
Remember that if a price drops by 50%, then it must go up by 100% to make up the loss: loss percentages and gain percentages are not created equal.
The two “2014″ readings for each tier in the chart below, refer to January 2014 and May 2014.
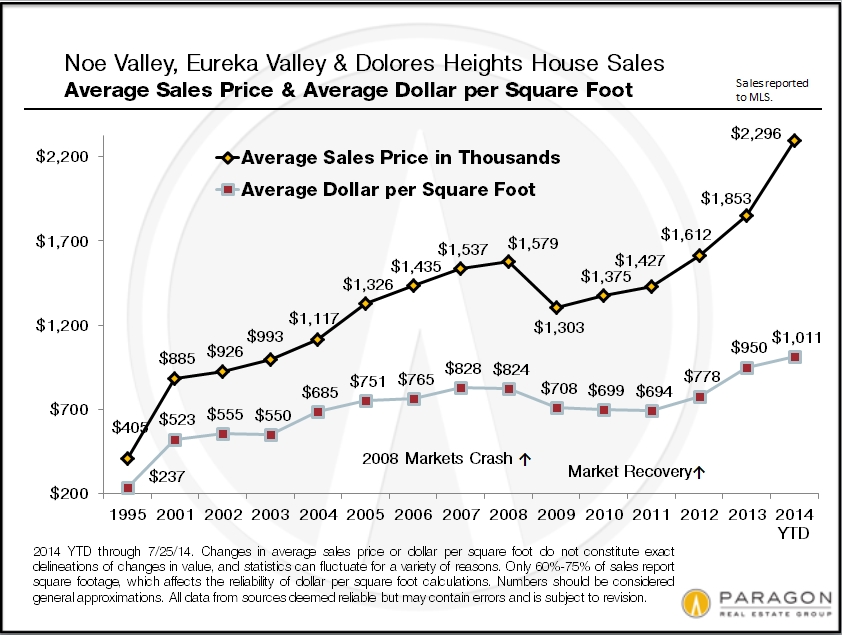
San Francisco County
And then looking just at the city of San Francisco itself, which has, generally speaking, among the highest home prices in the 5-county metro area (and the country): many of its neighborhoods are now blowing past previous peak values. Note that this chart has more recent price appreciation data than available in the Case-Shiller Indices. This chart shows both house and condo values, while the C-S charts used above are for house sales only. Median prices are affected by other factors besides changes in values, including seasonality, new constructions, inventory available to purchase, and significant changes in the distressed and luxury home segments. Short-term fluctuations are less meaningful than longer term trends.

And this chart for the Noe and Eureka Valleys neighborhoods of San Francisco shows the explosive recovery seen in many of the city’s neighborhoods, pushing home values far above those of 2007. San Francisco, San Mateo and Santa Clara counties are most effected by the high-tech wealth effect on home prices. Noe and Eureka Valleys are particularly prized by this buyer segment and the effect on prices has been astonishing.