
After the feverish spring 2014 market, home prices in the high-price tier – which applies best to San Francisco and Marin counties – flattened and then ticked down a little, while more affordable home segments continued to tick up: It’s not unusual for the market to cool off and plateau during the summer months. The October 2014 Case-Shiller Index just released (on December 30), begins to reflect the autumn selling season, which starts after Labor Day: The market typically begins to heat up again in autumn. (Note that transactions negotiated in September generally start closing in October.) ...
New Case-Shiller Index Report
The Case-Shiller Index for September was released today. Note that it will mostly reflect sales negotiated in August or before, during the slower summer sales season. (The next Index, published in late December, will begin to reflect transactions negotiated in September and the start of the autumn sales season.) These 2 charts pertain to the upper third of sales for 5 Bay Area counties – upper third by price range. The majority of home sales in San Francisco, Marin and San Mateo are in this upper price tier. ...
August Case-Shiller Index Report
The August Case-Shiller Index report released today showed a small home price decline for the 5 counties of the SF Metro Area. Autumn’s numbers will give us a clearer indication as to whether this is the beginning of a flattening or declining price trend or simply the not untypical indication of a summer adjustment from the spring frenzy. PDFs are attached.
3rd Quarter 2014 Market Report
San Francisco House & Condo Values
Which Neighborhoods Dominate Home Sales?
Who Is Buying the City’s Luxury Condos and Why?
September saw the largest surge of new listings coming on market in the past 2 years, which led to a big jump in deal-making, but data on transactions negotiated in September won’t be available until most close escrow in October and early November. In the meantime, we’ll look at the last 2 quarters.
Median Sales Prices
& Average Dollar per Square Foot
The following 2 charts look at current and longer-term trends in home values. As is common, median house sales prices dropped a bit in the 3rd quarter – this is due mostly to seasonality issues – though condos have held steady for 3 quarters now at $950,000. Dollar per square foot values have continued to increase to new peaks: This metric is particularly being impacted by new-development condo sales, which are breaking dollar per square foot records virtually everyplace they’re being built.
If you wish to drill down on values in very specific city neighborhoods, we recently updated our interactive map, which can be found here: SF Home Price Map ...
Freshly updated map of what’s going up around town

Interested in what’s happening with new developments in San Francisco? Click the link below to view the interactive map…
http://www.parascopesf.com/development-map/
Source : Parascopesf.com
Case-Shiller sees small drop in Bay Area home prices in July – 3 charts included
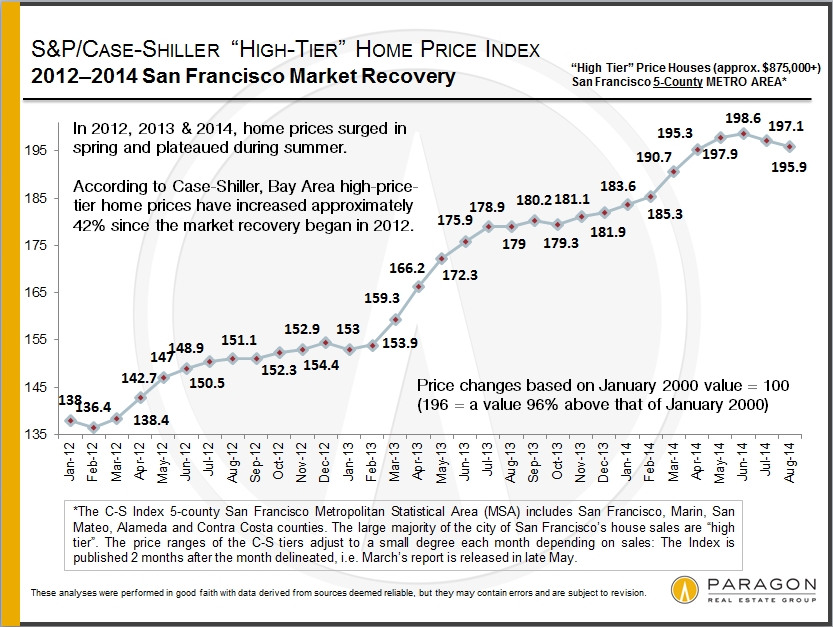
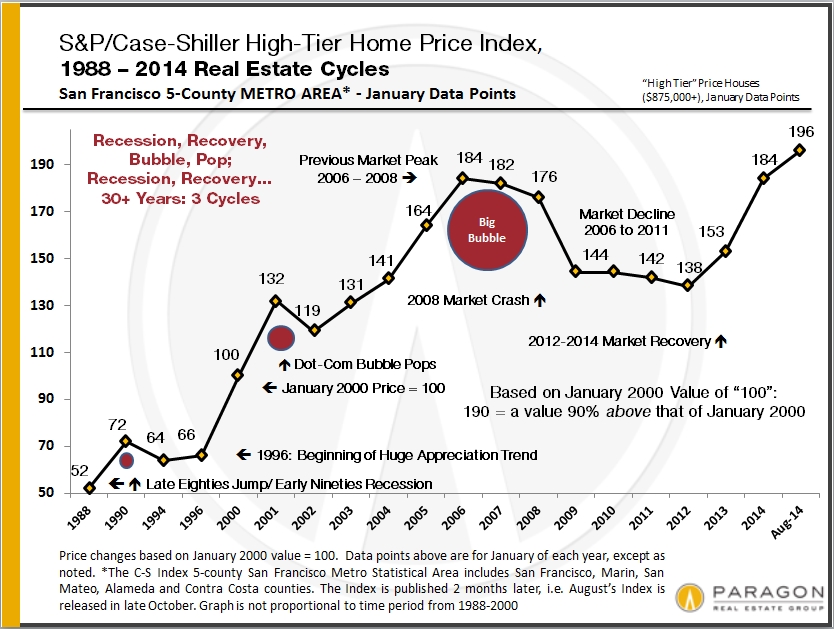
The S&P Case-Shiller Home Price Index for July 2014 was released today, and indicated a small – less than 1% – dip in high-price-tier houses. (The Case-Shiller aggregate Index for all Bay Area home price tiers dropped even less, about 4 tenths of a percent.)
For the past 3 years, home prices have surged in the spring and then plateaued during the summer. It is too early to speculate whether home prices are trending down a bit after the spring market frenzy, which is certainly possible. For any definitive sense of home price trends, we will have to wait until the autumn-selling season numbers are in. Autumn this year began with a big surge in the number of new listings in September. ...
New Case-Shiller report: new jump in Bay Area home prices
The new S&P Case-Shiller Home Price Index for April 2014 came out today and it showed another bump in home prices for the 5-county San Francisco Metro Statistical Area. For homes in the upper tier of home values – as … Continue reading
New Case Shiller Index
The new February S&P Case-Shiller Index for high-price-tier homes in the 5-county San Francisco Metro Area increased almost 1% from the January reading. This puts the Index up about 20% over the past 12 months, and up about 34% since … Continue reading