
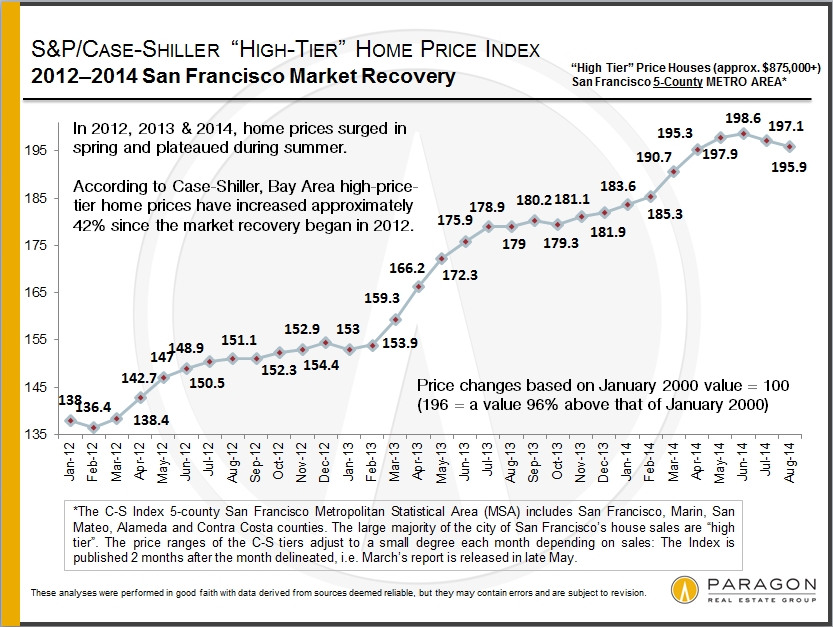
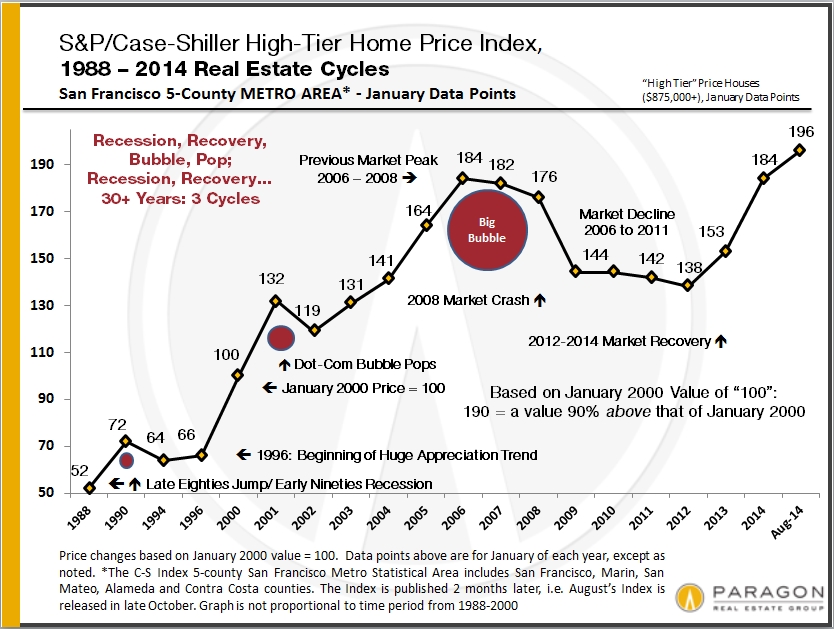
The Case-Shiller Index for September was released today. Note that it will mostly reflect sales negotiated in August or before, during the slower summer sales season. (The next Index, published in late December, will begin to reflect transactions negotiated in September and the start of the autumn sales season.) These 2 charts pertain to the upper third of sales for 5 Bay Area counties – upper third by price range. The majority of home sales in San Francisco, Marin and San Mateo are in this upper price tier. ...
San Francisco Neighborhood Appreciation Rates
Which Neighborhoods Have Appreciated Most and Why?
4th Quarter 2014, Paragon Special Report
———————————————————————
Percentage Appreciation Rates
2010/2011 – Present
This analysis is based upon review of both median sales price and average dollar-per-square-foot data. However, there is no San Francisco or Noe Valley median or average home that one can use as the unchanging basis for comparison year after year, only differing collections of unique homes selling in different times and circumstances. Please see notes at the end of this report regarding our methodology. ...
Holiday Season Events 2014

San Francisco Autumn Real Estate Market Dynamics
SF Luxury Home Sales Hit New Peak
Neighborhood Snapshots: Noe & Eureka Valleys, South Beach
& Yerba Buena, Richmond District, Bernal Heights & Sunset/Parkside
November 2014 Update
The San Francisco market definitely cooled after the overheated feeding frenzy of the first half of the year. The competition between buyers for new listings declined to more rational levels: Homes that might have received 5 to 10 offers earlier in the year received 1 or 2 or 3. Values in many of the city’s neighborhoods plateaued or even ticked down a bit after spring’s big spike – the exception being districts with the most affordable house prices (under $1.2 million) where prices generally continued to tick up. The number of expired and withdrawn listings jumped 18% August through October when compared to last year, to over 460 listings, as buyers decided many sellers were pushing the envelope on prices too far. ...
Bay Area Demographics
18 charted analyses of ancestry, affluence, education, real estate,
politics, poverty and employment for San Francisco, Marin, Napa,
Sonoma, San Mateo, Santa Clara, Alameda & Contra Costa Counties.
4th Quarter 2014, Paragon Special Report
These charts are mostly based on U.S. Census surveys from 2010 to 2013. Each of the 8 counties examined contains areas of widely varying demographics, and the multiple reports analyzed (6+ for each county) contain counts and estimates made at different times. Though these statistics are broad overviews, we still found many fascinating insights – and hope you will as well. ...
August Case-Shiller Index Report
The August Case-Shiller Index report released today showed a small home price decline for the 5 counties of the SF Metro Area. Autumn’s numbers will give us a clearer indication as to whether this is the beginning of a flattening or declining price trend or simply the not untypical indication of a summer adjustment from the spring frenzy. PDFs are attached.
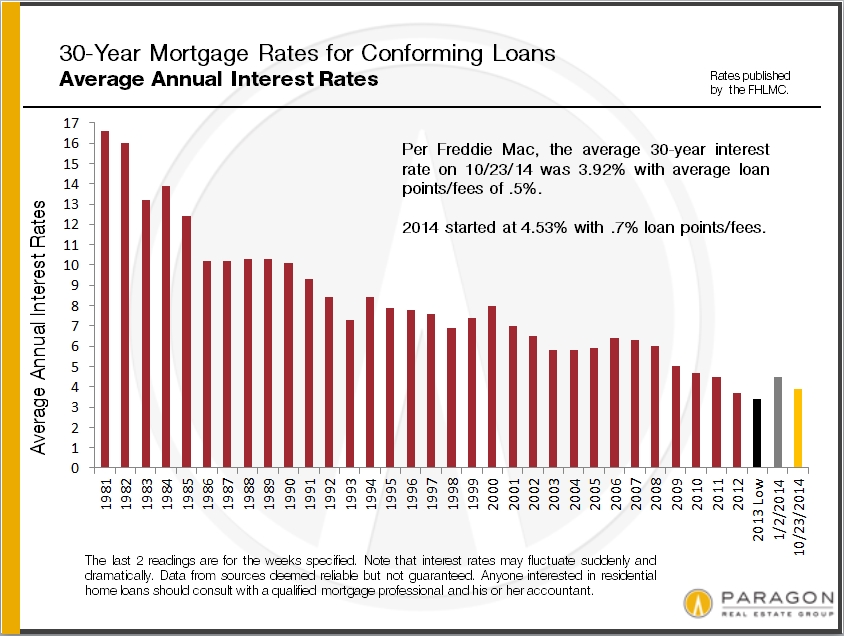
Mortgage Interest Rates Just Hit a 16-month Low
3rd Quarter 2014 Market Report
San Francisco House & Condo Values
Which Neighborhoods Dominate Home Sales?
Who Is Buying the City’s Luxury Condos and Why?
September saw the largest surge of new listings coming on market in the past 2 years, which led to a big jump in deal-making, but data on transactions negotiated in September won’t be available until most close escrow in October and early November. In the meantime, we’ll look at the last 2 quarters.
Median Sales Prices
& Average Dollar per Square Foot
The following 2 charts look at current and longer-term trends in home values. As is common, median house sales prices dropped a bit in the 3rd quarter – this is due mostly to seasonality issues – though condos have held steady for 3 quarters now at $950,000. Dollar per square foot values have continued to increase to new peaks: This metric is particularly being impacted by new-development condo sales, which are breaking dollar per square foot records virtually everyplace they’re being built.
If you wish to drill down on values in very specific city neighborhoods, we recently updated our interactive map, which can be found here: SF Home Price Map ...